Introduction
Here we introduce a new chartting add-on, a component that integrates Javascript chartting library, jqPlot, which works well on most browser (including IE6) and overcomes some shortages of the current charting solution in ZK.
Why ZK jqPlot?
Current solutions of chart plotting in ZK includes the use of JFreeChart Engine and Flash Chart, both of which are already integrated with ZK. However, ZK jqPlot provides another option for developers and can solve some of the issues raised by the two:
- JFreeChart Engine processes data on the server and output a static image to client, this means that this would require more server load. By constrast, jqPlot plots the chart by Javascript alongside HTML5 canvas element which makes it more efficient.
- HTML5 is the trend at the moment whereas Flash may not be supported on mobile in the future and may raise compatibility issues
How to use?
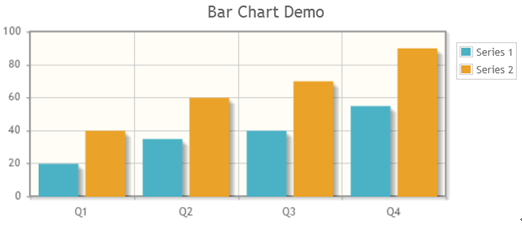
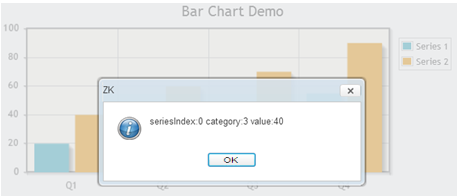
The following example is a bar chart with onClick Event that alerts some information.
If you have tried chart component on the ZK Live Demo, you may notice the code is almost the same – it is easy to migrate to jqPlot add-on from existing solution.
<zk>
	<jqplot id="barchart" title="Bar Chart Demo" type="bar" orient="vertical" width="600px" height="250px">
		<attribute name="onClick">
		<![CDATA[
			Map map = event.getData();
			List data = map.get("data");
			alert("seriesIndex:" + map.get("seriesIndex") + " category:" + data.get(0) + " value:" + data.get(1));
		]]>
		</attribute>
		<zscript><![CDATA[
			CategoryModel catmodel = new SimpleCategoryModel();
			catmodel.setValue("2001", "Q1", new Integer(20));
			catmodel.setValue("2001", "Q2", new Integer(35));
			catmodel.setValue("2001", "Q3", new Integer(40));
			catmodel.setValue("2001", "Q4", new Integer(55));
			catmodel.setValue("2002", "Q1", new Integer(40));
			catmodel.setValue("2002", "Q2", new Integer(60));
			catmodel.setValue("2002", "Q3", new Integer(70));
			catmodel.setValue("2002", "Q4", new Integer(90));
			barchart.setModel(catmodel);
		]]></zscript>
	</jqplot>
</zk>
This add-on is currently under construction, but it already supports some basic features of chart plotting. You can download the source code here and try more examples.
Look great, but it’s only support zk pe/ee ?
Hi, zjinys :
Thank you for your comment.
It supports ZK CE/PE/EE.
It Look great!!!
where is the documentation for this? how to create chart other than bar chart?
Problem in parameter TYPE value stackbar:
<jqplot id="barchart" title="xxx" type="stackbar" …..
Show plot type default ("line")
How to change default label: “Series 1”, “Series 2”, “Series 3”
How to show value on chart
Hi,
This is no longer in maintenance, we would suggest using ZK Charts (highcharts) solution instead.